The DIKW acronym has worked into the rotation from knowledge management. It demonstrates how the deep understanding of the subject emerges, passing through 4 qualitative stages: “D” – data, “I” – information, “K” – knowledge and “W” – wisdom. The latter is, hence, the ultimate stage of any cognition process.
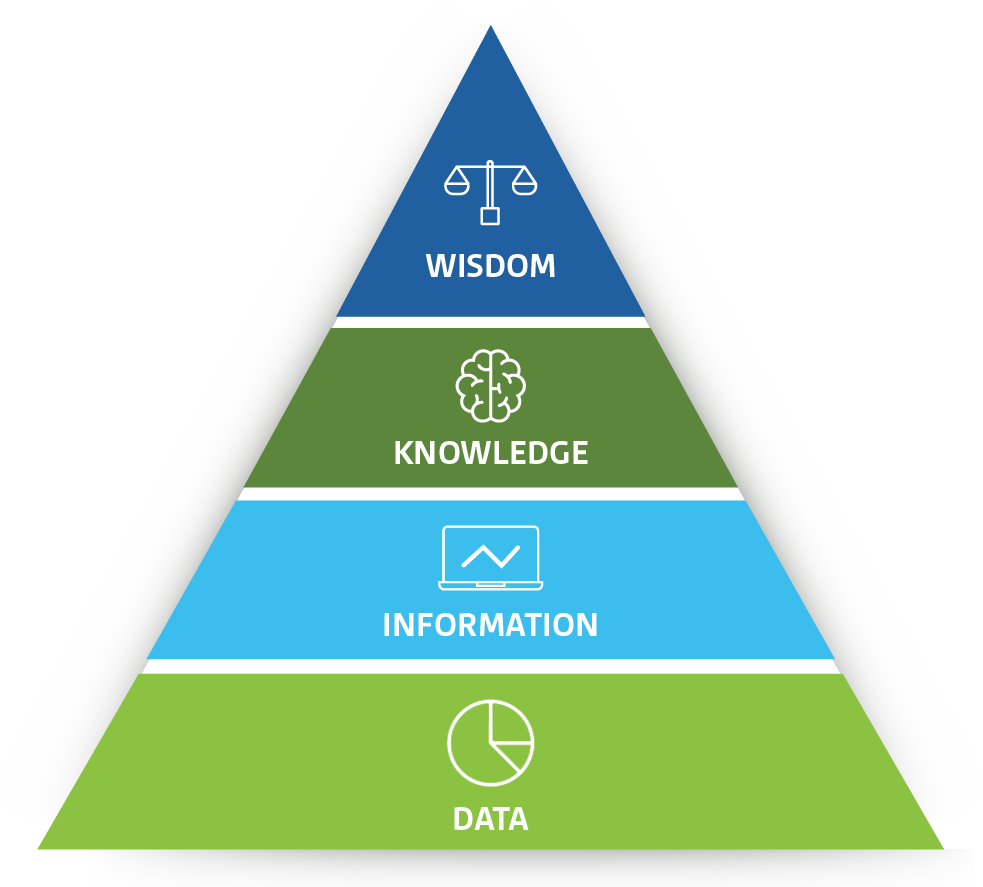
“Data → Information → Knowledge → Wisdom” hierarchy, image source
This approach is philosophical, in a way, because it emphasizes the difference between categories. Facts alone are not the information, nor the knowledge is wisdom. Look at these interpretations:
- Data is numbers and facts.
The data is what it all starts with, it is undeniable and deprived of the context. The data analytics doesn’t make much sense on its own. Look at the following DIKW examples with the rainy weather:
A rainy day is an objective reality. This is something everybody can see and even feel – a fact. Without context and interpretation, the fact that it’s raining is useless, as a whole. Now, let’s suppose the airport dispatcher has to decide whether to correct today’s schedule or not. He or she will probably collect data about the rain itself, as well as general flights’ characteristics:
- cyclone direction
- clouds’ speed
- estimated precipitation
- airstrips coverage
- daily take-off and landing schedule etc.
All these form the context for coming up with a specific decision. That is, raw facts are being transformed into information.
- Information is the data enhanced with context, the purpose of analysis and analytical methods.
Think of stock exchanges’ quotes tables. The numbers alone show as much as nothing, right? However, if you know units and reporting time frames, you’ll probably be able to make some calculations and draw conclusions about biddings:
- who lead the stock market
- who was the market outsider
- who had the highest growth ratio
- and who stagnated.
Investors use this information to make their day-to-day decisions about whether to escalate the portfolio or sell stocks. And real professionals use it to check their assumptions and make far-reaching predictions. In other words, they acquire the knowledge.
- Knowledge comes up from the information that has been accumulated over time. These are axioms, theories, concepts, or definitions.
Iron laws of Economics, such as the supply-and-demand model, have derived from the identification of patterns in both consumers’ and seller’s long-term behavior.
- Wisdom is what the subject eventually comes to after having worked with information for a long time and having received a sufficient amount of knowledge.
Being aware of, comprehensive, mindful – these are all synonyms of being wise. Wisdom gives an ability to predict some events’ scenarios, based on past experience. Referring to the example with the stock exchange: outstanding investors, like Warren Buffett or Peter Lynch, turned out to be more successful thanks to both the colossal experience and bidding wisdom, in a sense.
Now that you know what is data, information, knowledge and wisdom, let’s move on to how it can be used for daily and long-term decision-making in practice.
DIKW pyramid in decision-making
The DIKW hierarchy to decision-making seems to be simple – but only on the surface. In theory, managers collect data, the information drives their decisions, and quality assurance provides knowledge and evolves to wisdom. The reality is more pragmatic, however:
- people can be too overwhelmed with the data and stuck the bottom of the pyramid
- there may be too little or too much time spent to move onto the next level
- some steps, willfully or not, might be skipped.
But the main threat appears when analytical and decision-making processes go in parallel and do not intersect. The data-driven approach not only answers to “what?” and “why?”, but suggests “what’s next” and “how to do it right”. Hence, the DIKW pyramid shall be enhanced with the 5th step – the decision itself.
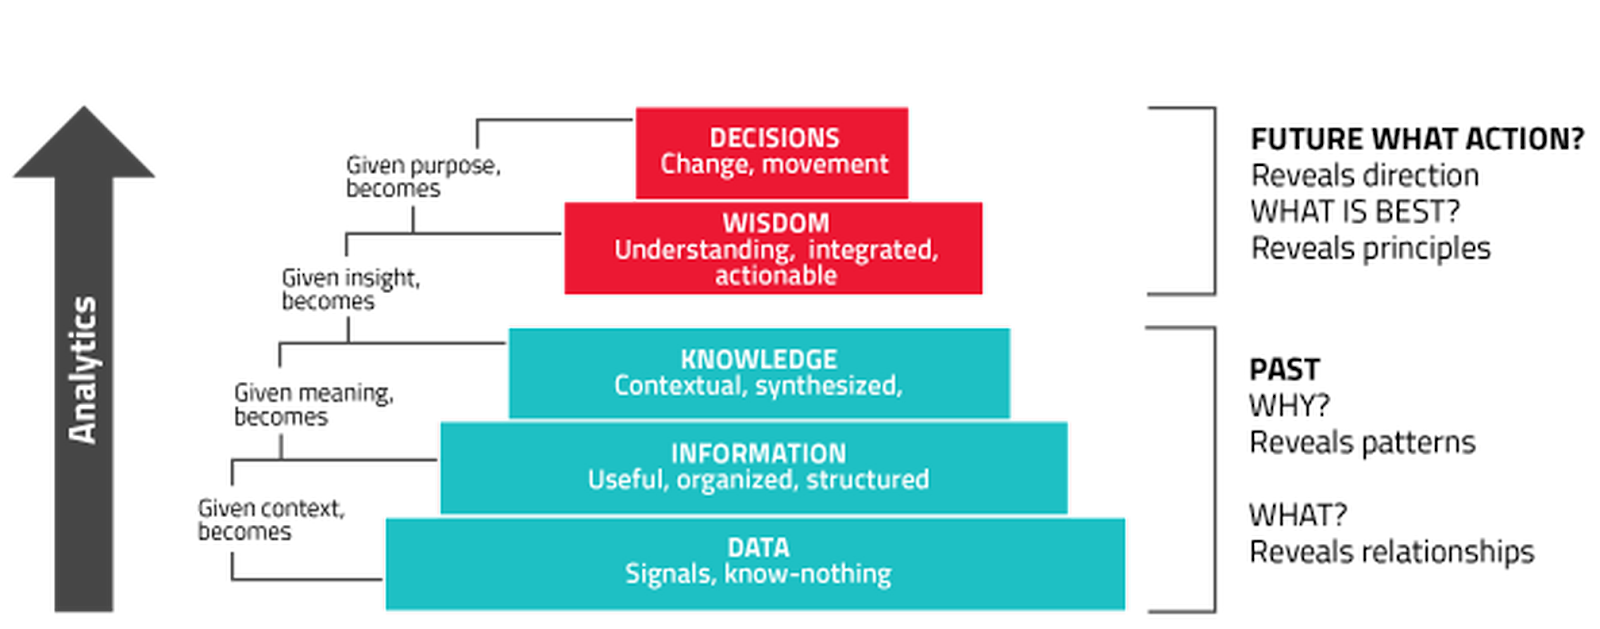
How raw data is transformed into business decision, image source
Here’s the decision making cycle, based on the data-driven approach:
- Bulk data collecting through measurements, logging, tracking or recording
- Data organization, processing and storage with the use of BI software
- Evaluating past experience
- Coming up with the actions plan
- Taking actions
- Analyzing first results and correcting the initial plan
- Analyzing long-term consequences of the decision and capturing the experience.
The 4th and 5th steps are where the pyramid ends, while the 6th and 7th are what closes the loop of the advanced DIKW pyramid.
How to scale up and measure the DIKW model with Weje?
Without scaling and evaluating the DIKW model remains a concept – not something you can apply. To adapt this to a daily routine, use all-in-one software solutions, such as Weje. This is a true on-hand personal assistant when it comes to dealing with data – for both individuals and organizations.
Imagine your company develops ‘turnkey’ landing pages for B2B clients. To deliver projects, aside from the specification alone, you’ll probably need to consolidate a number of other inputs:
- technologies – what programming languages are to be used to ensure webpages’ functions
- resources – what professionals are required to do tasks
- visuals – what the design should be
- budgeting – how costs will be distributed
- timing – what milestones shall you plan.
Weje has a straightforward instrument for organizing relevant data, which is a canvas. Here, you can upload documents from the computer or drag & drop relevant figures, content extracts, or images – right from the Web.
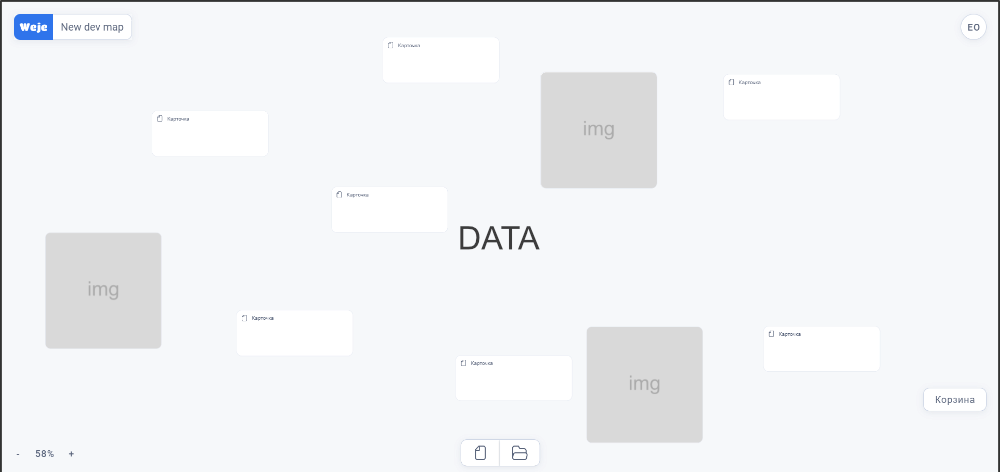
Provide co-workers with access to the dashboard, so that everyone can work separately with his or her data scope. No more fear of dismissing something important – the project’s dossier will be in one place.
Now that all figures are in place, it’s time for classification and distributing them into blocks. Use Weje tools – write lists or checklists, create libraries or mind maps, sort and range the data. You can easily do this by moving and merging separate data cards. The process is native, thanks to the well-designed interface.
In the case of landing pages’ development – the information can consist of the following separated blocks:
- design insights
- content ideas
- web hosting inputs
- a “what-makes-these-all-work” chapter – HTML/CSS/JS.
After you’ve prepared and classified the information, tie it all together and come up with the knowledge over the project.
At this point, make sure that the work within the team is synchronized. Take advantage of Weje collaborative tools, such as Kanban boards, meetings’ scheduling and to-do lists. Use Weje to create corporate databases, share performance analytics and project cases within teams. Remember, your experience is your best teacher to end up with business wisdom.
The final step the DIKW model leads us to – is the decision itself. With Weje, it’s not only you transform raw data – you get the visual evidence of further to-do-steps.
The canvas you worked on is a true prototype of the project. You don’t need to transfer findings into documents or separate presentations – simply share the link with the project’s stakeholders to launch discussions or come to the realization.
In a nutshell
The 2018 McKinsey survey has shown data-targeting companies tend to be more effective than their competitors, thanks to clear data strategies and strong data-governance practices. Hence, the “Data, Information, Knowledge, Wisdom” model is crucial for developing a “data-first” culture within the company’s decision-making process.