Chances are, you’ve seen a flowchart or used one at some point. After all, this type of diagram is a more creative and detailed way to present a system, process or algorithm, so that it’s easy to communicate even complex steps to a wider audience.
The process flow chart was first introduced by industrial engineers Frank and Lillian Gilbreth in the 1920’s to the American Society of Mechanical engineers. Ten years later, industrial engineer Allan H. Morgensen used the same tool for conferences on work efficiency. A student of Morgensen, Ben S. Graham eventually used process flow charts for information processing.
Since then, the humble business flow chart has evolved into different forms and is now being used in various industries and processes. Today, you see process flow charts just about everywhere and there are many tools that you can use to create one for your own use.
When is a flowchart necessary?
We already answered the question: what is a flow chart? Now, let’s learn about the different uses of a flowchart diagram:
- Task tracking. As a business, it’s very important to maximize productivity and the first step to achieving that is by knowing the time it takes to complete a task in your process. A process flow diagram is a great way to track tasks and their timing through linear charts that read from left to right.
- Work process definition. One of the most basic uses of a flowchart is to define and describe a process from start to finish using lines, shapes and images. This allows for a simpler and clearer visualization of an entire process as opposed to writing down everything in words.
- Troubleshooting. Fixing problems and troubleshooting can be a huge challenge if you don’t have a proper process in place. But with the help of a process map, it’s a lot easier to identify bugs and issues and what stage in the process they took place. This will help you troubleshoot faster and fix problems in the most efficient way possible.
What are the different flowchart symbols?
Before you learn how to create a flow chart, here are some of the most common flowchart symbols that you need to know about:
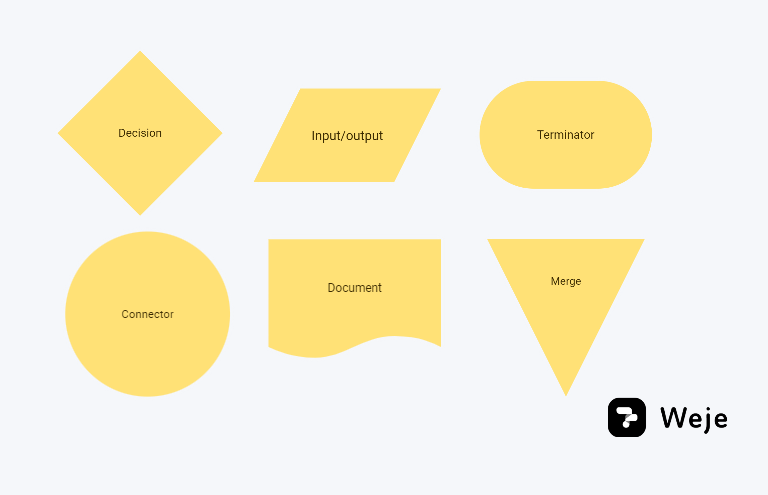
- Decision symbol. Also called the branching symbol, the lines emerging from different points of the diamond usually represents decisions made throughout the process.
- Input/output symbol. This symbol represents information joining or leaving the process system.
- Connector symbol. A connector indicated that a process flow continues where a similar symbol with the same letter has been placed.
- Document symbol. This symbol represents information that’s documented on paper or through email. If you have a document that’s part of the process, you need to use this to differentiate that information from other data on the flowchart.
- Terminator symbol. This symbol marks the beginning or end of a system and it usually contains the word “Start” or “End” in the process flow chart.
- Merge symbol. This symbol indicated the part of the process flow diagram where two or more sub-processes or sub-lists will merge into one.
How do you make a flowchart?
Whether it’s your first time making a process flow diagram or not, here are some tips that you might find useful:
- Be clear with your goals. Always start by defining the purpose of your flowchart. This will allow you to easily set the right start and end points for your flowchart diagram to be as clear yet as simple as possible.
- Organize your tasks properly. Before you could start putting your flowchart together, you need to organize all the information you need into a rough chart. You can look at flowchart examples to get some ideas on how you should put your tasks in chronological order.
- Identify the symbols you need to use. Symbols are very important in a flowchart diagram because they will help your audience understand your process flow better.
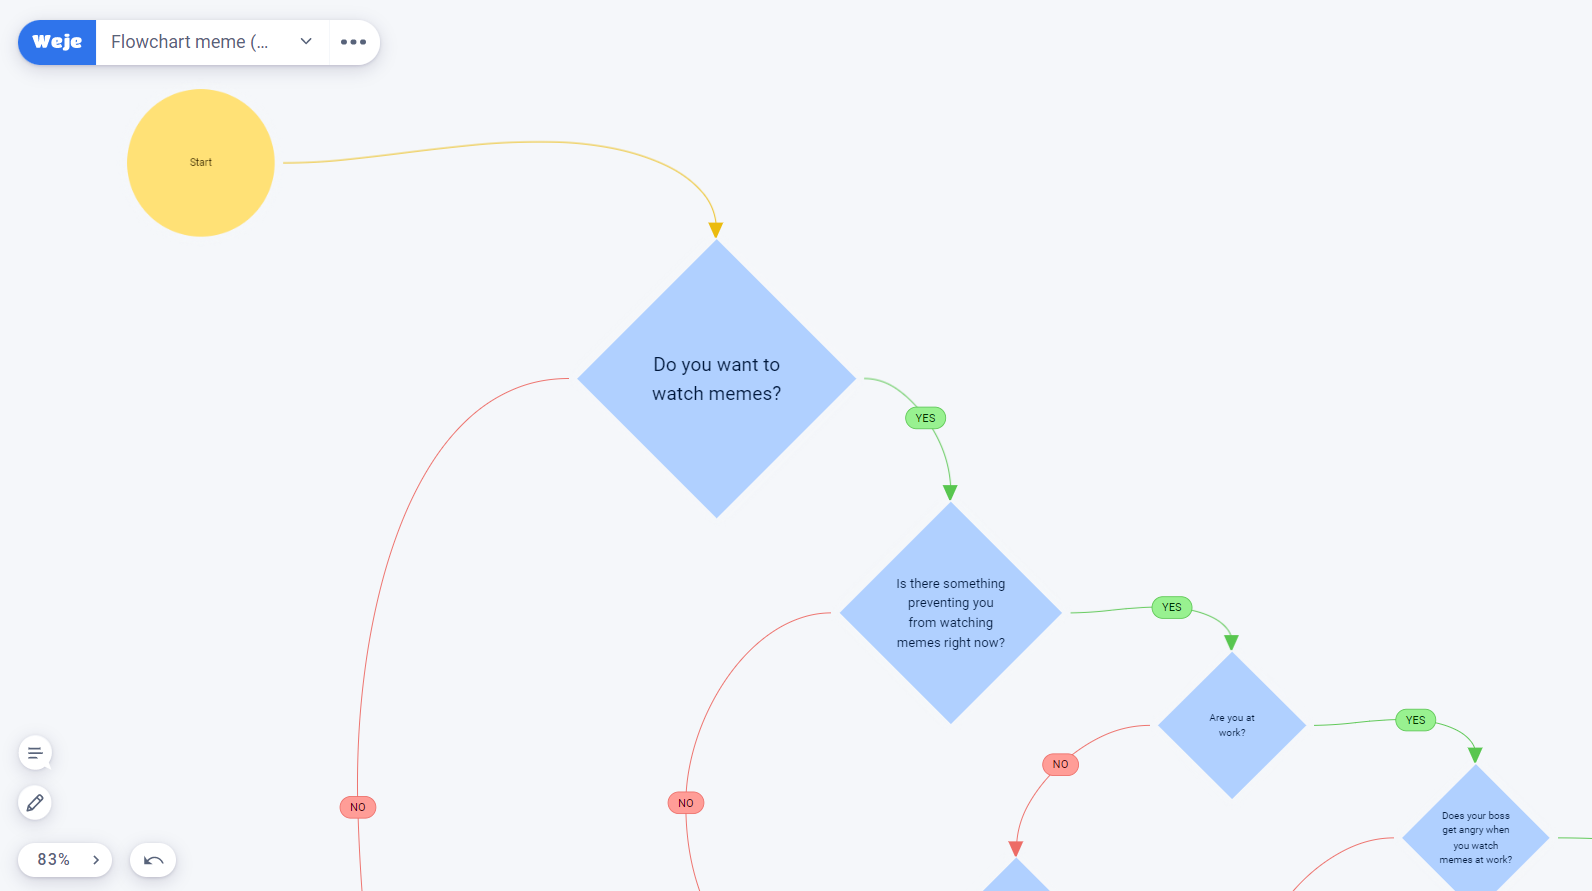
- Draw your chart. Use the symbols that you determined and put them together in a way that explains your process clearly and concisely.
- Review your flowchart. After you finished everything, you should review your flowchart with your team to make sure that you didn’t miss anything and correct some errors before you use it for your presentation.
What are the types of flowcharts?
While a lot of different flowcharts have been created throughout the years, these four are the most common ones that you’ll find in most organizations:
- Data flowchart. This is used to describe the different channels in which data is transmitted throughout the process.
- Document flowchart. The most basic type of flowchart, this is used primarily to show the flow of documents across different business units and how it is controlled by the system.
- System flowchart. This describes the flow of data within a process system and all the components used to make it happen such as programs, data, storage and processors.
Create your own flowchart with Weje
A process flow chart will help make complicated processes and systems a lot easier to explain. It will also make your presentations easier to understand and refer to, so you and your team are on the same page.
So, if you haven’t tried making one yet, you can choose the best tool to create your own flowchart for your organization.
Published: January 19, 2022