Visual Ops: How Whiteboard Thinking Turns Messy Schedules Into Repeatable Wins
The tools we use shape the way we run a day. Give a team a blank canvas and sticky notes and they’ll map ideas; give operations the same canvas and they’ll map time—who’s on, where the bottleneck is, and what must change by 4 p.m. That “whiteboard brain” is the missing link between strategy decks and the moment a customer needs help right now. When you pair that mindset with a live scheduling backbone—think a single place to publish shifts, move people, and see impact—coordination stops being a group chat and starts being a system. A practical example is shifton.com, which lets you plan and steer coverage like you’d sketch it on a wall, only faster and without the smudges.
From Kanban Lanes to Coverage Lanes
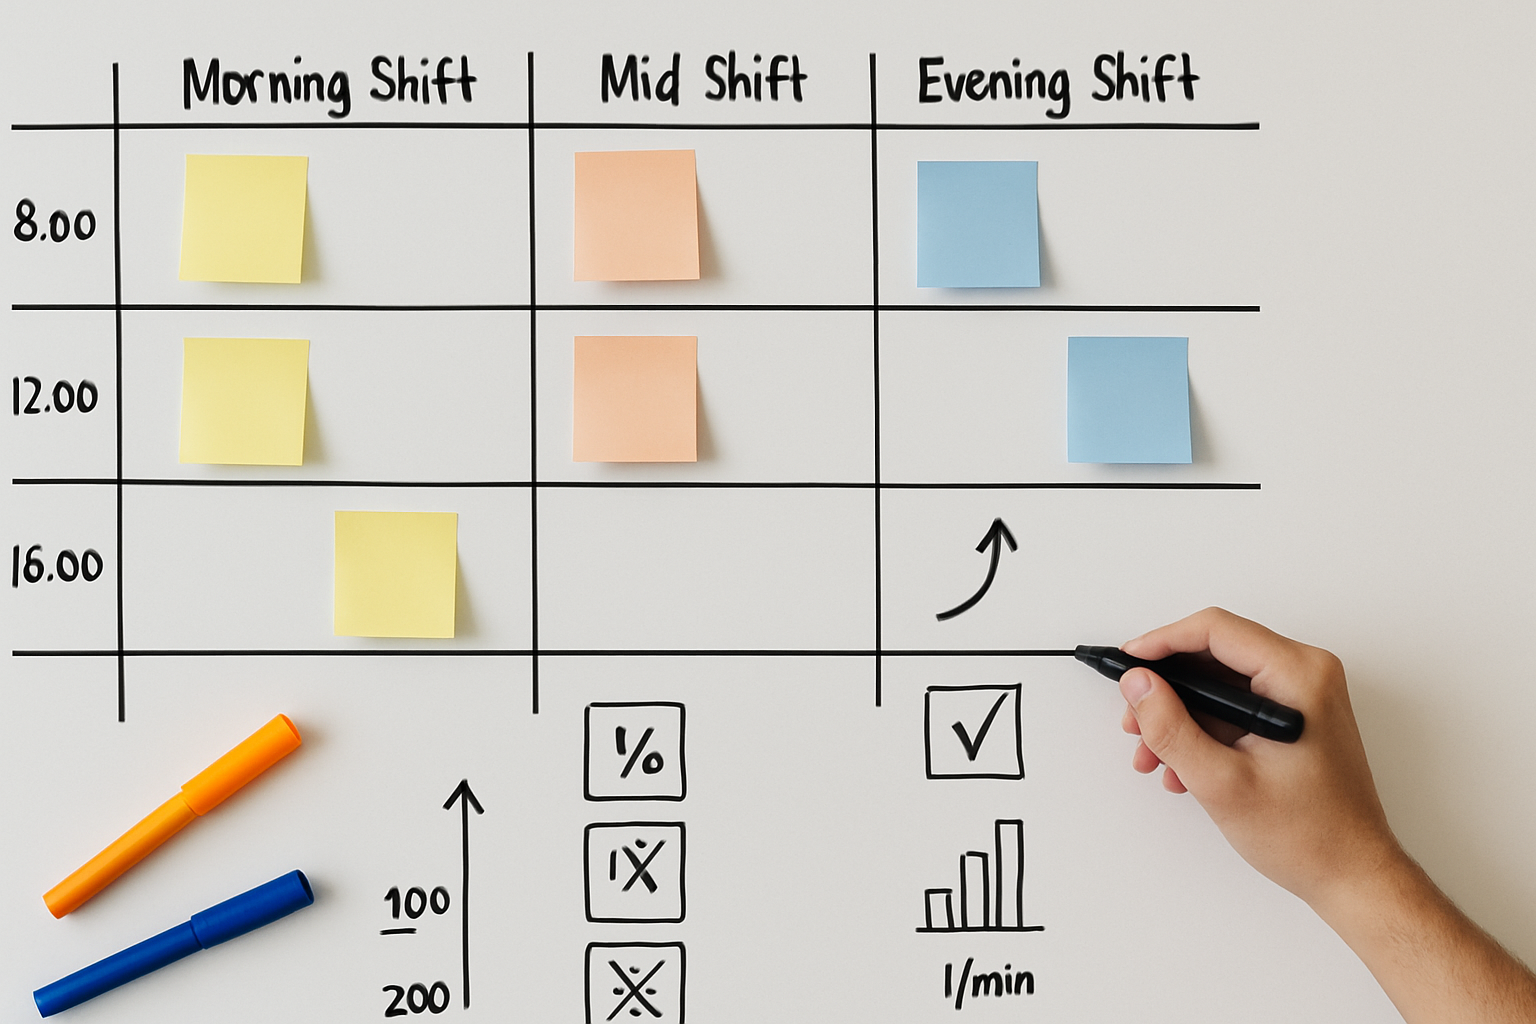
Kanban boards are great for showing “what” work exists; operations need a board that shows when work hits and who is ready to catch it. The difference is subtle but huge. Instead of cards traveling from “To-do” to “Done,” you’re aligning capacity to the spike at 11:30, the after-work rush at 18:00, and the quiet window you’ll use to clear backlog.
That is why a shift planning system matters: it translates demand curves into humane, focused coverage. With a tool built for it, you can model micro-shifts (2–4 hours), set overlaps at hand-offs, and keep guardrails so no one closes and opens on the same day. Here’s a good place to start: shift planning system.
Live Changes, Not Loud Chats
Most “fire drills” aren’t caused by a lack of effort—they happen because updates travel too slowly and inconsistently. The fix is a control surface where a lead makes one change and everyone sees it in the same minute, with a short reason attached. That’s the essence of real-time team coordination: short instructions, audit trail, and clear ownership per zone (support, social, web, payments, fulfillment).
When comment velocity doubles or a payment method blips, you don’t need a meeting; you need a 30-minute micro-shift on the right queue and a one-line note that says why. Tools designed for this reduce thrash dramatically. Explore real-time team coordination and you’ll see how dispatch, role clarity, and confirmations replace the scrollback hunt.
Micro-Truths Front and Center
Great ops are strangely quiet—they publish small truths in the exact place confusion starts:
- “Discount applies at checkout.”
- “ETA updates every 15 minutes.”
- “Wallet retry keeps your discount.”
That’s UX, not only comms. When you place micro-truths in banners, FAQs, and responses, you prevent redundant tickets and keep sentiment stable. Pair that with the schedule and you turn silence into signal: if the ladder shows “cart → payment” drop-off, you adjust the message first, then the layout, then the code. Your schedule changes should follow the same rule—reversible moves first.
Metrics That Actually Change Behavior
Vanity dashboards don’t help a team steer a Tuesday. The metrics that do:
- Labor % by hour vs. demand (flatten the curve; avoid peaks and troughs).
- Cost per shift/job per zone (is “help desk” overbuilt while “handoff” starves?).
- SLA attainment with variance (how far off and when).
- Schedule stability (late edits, call-ins, stay-overs).
The moment these numbers turn into a habit—reviewed in a 15-minute stand-down—you get compounding gains. If you want a simple way to put those numbers in one place and export them for finance, look at a report-ready workforce metrics dashboard.
Case: The Minute-12 Code Storm
A retail brand launched a “buy-more, save-more” promo during a creator live. At 12 minutes in, chat filled with “code not working.” The lead inserted a micro-truth (“Discount applies at checkout”), moved one associate from phones to chat for 30 minutes, and the web owner toggled a wallet flag causing partial failures. With real-time coordination, the schedule nudge and the fix happened in the same five minutes. Conversion stabilized within eight minutes; refunds stayed below baseline. No heroics—just choreography.
Your Visual-Ops Playbook (Steal This)
- Draw the day like a timeline: the launch, the echo, the quiet. Place micro-shifts around waves with 20–30 minute overlaps.
- Assign zones with one owner and one fallback. Publish five-line checklists (“what I do in the first 10 minutes”).
- Pin micro-truths where new users land: cart/checkout banners, promo blocks, first reply in hot threads.
- Review five tiles every 15 minutes: Sessions→Cart→Pay ladder, backlog & oldest waiting, p95 first response, payment error rate, units/min vs. stock.
- Do one reversible move at a time, measure, then keep or roll back.
- Close with a 20-minute retro after the echo wave. Archive what worked into next week’s template and delete the rest.
Why This Works
Visual ops keep everyone oriented: the plan shows time, not just tasks; the board shows capacity, not just cards; the metrics show direction, not just totals. And because the system prefers small, reversible moves, teams stay calm and customers feel the calm.
Published: October 2, 2025