The Unpredictability of Modern Planning
Projects rarely move in a straight line. Deadlines shift, suppliers run late, weather changes course, and priorities collide without warning. Even a careful timeline can unravel when the unexpected hits.
Resilient teams treat planning as a living process instead of a fixed schedule. They map ideas visually, keep communication open, and bring in real-world data to ground decisions. Adding context like trends, timing, or environmental conditions turns fragile plans into flexible ones.
For groups managing events, travel, or field work, bringing weather insights and reliable forecasts into the board can be the difference between reacting and staying ready. Clear context helps a visual plan see what is coming and support better choices early.
Visual Planning: Turning Uncertainty Into Clarity
When the world feels unpredictable, visuals bring order. A shared board gives shape to abstract ideas such as tasks, dependencies, and milestones, so everyone can see how their work fits into the bigger picture. Color-coded notes, timelines, and clusters transform scattered details into actionable items for teams.
Visual planning encourages systems thinking instead of siloed work. It makes shifting details visible and manageable. If a supplier delay pushes a delivery date, or weather threatens an outdoor project, the plan can be rearranged in seconds. Seeing how one change affects the rest makes adjustments faster and less stressful.
This clarity also builds alignment. Instead of long update threads or scattered files, the plan lives in one place. New contributors can understand it at a glance without searching through old notes or guessing what is current.
Using Real Data to Strengthen Your Plans
Planning visually makes the work easier to see. Pairing those visuals with real-world data turns the board into a living reflection of changing conditions.
Data layers give every decision context. A sales team can place market signals next to campaign schedules and spot useful patterns. An educator can map semester milestones while tracking local weather or attendance. When the plan reflects real conditions, choices feel grounded and timely.
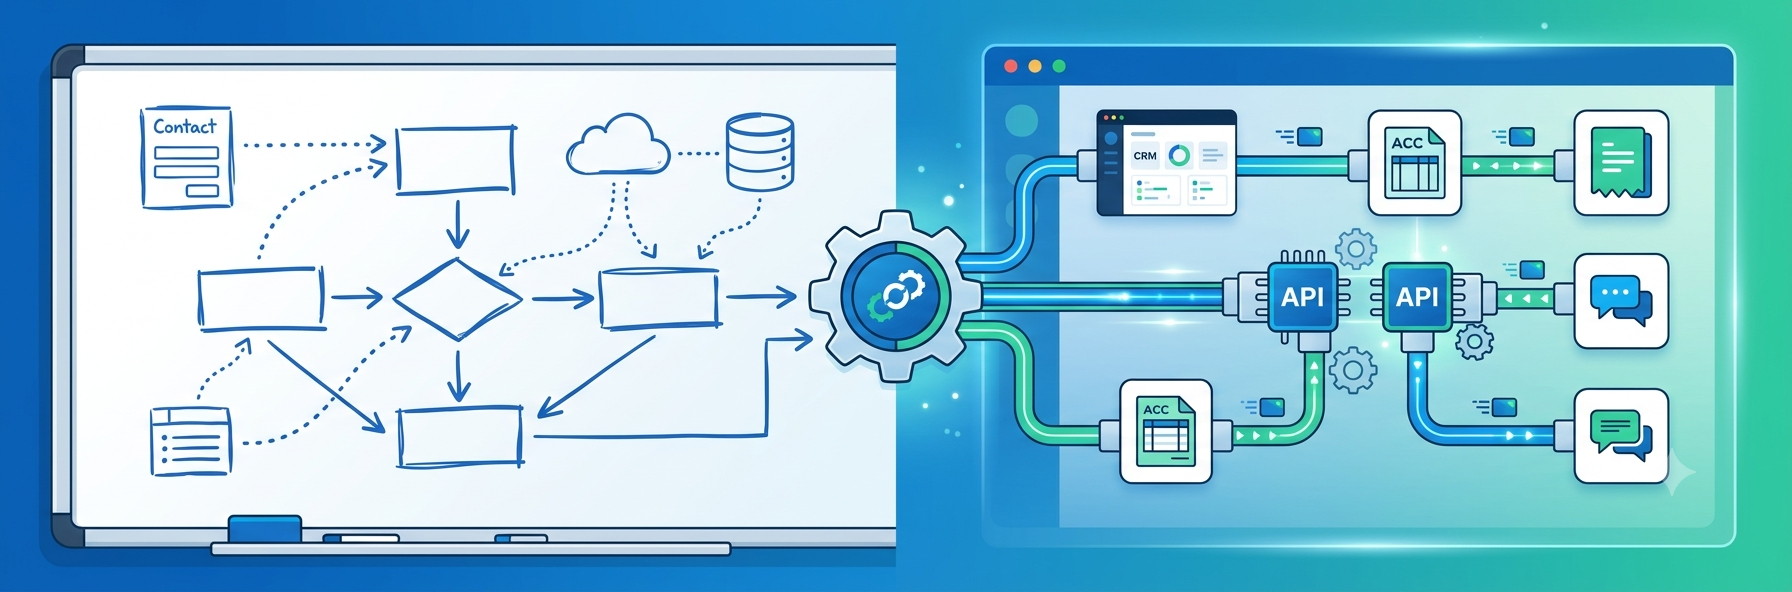
External data sources make this simple. APIs can feed accurate information, such as temperature forecasts, supply levels, or traffic flow, directly into the workspace. Teams that combine their visuals with reliable data are better prepared to adjust timelines, resources, or priorities before small issues grow.
Organizations that build plans around live data respond to disruptions faster and perform more consistently under pressure, according to Harvard Business Review. When you bring data into view, uncertainty becomes something you can work with, not against.
Real-World Example: How Weather Data Enhances Team Planning
Picture a team organizing an outdoor product launch. Every detail, from venue setup to deliveries and equipment checks, depends on the weather. A sudden storm or heat wave can throw the schedule off. A visual board keeps the plan flexible, but adding weather data takes that flexibility further.
With a feed from a historical weather and forecast API, the team can spot patterns and anticipate risk. If the last three years show heavy rain during the same week, they can book a covered backup space or shift the date. As forecasts update, the board updates too, so everyone understands the latest plan without a string of last-minute messages.
The same approach works beyond events. Construction crews plan around safe working conditions. Educators adjust outdoor activities. Remote teams time campaigns around seasonal patterns. When these insights live on the board, planning feels calm and confident, even when conditions change.
Making Your Planning “Weather-Proof”
Resilient planning grows from small, consistent habits. Visual tools make those habits easier, because every adjustment becomes visible and shareable. Start with a few practical steps.
- Add context to your plans. Bring in the information that shapes outcomes, including weather data, delivery windows, budgets, and resource availability. The more relevant context on the board, the fewer surprises later.
- Visualize dependencies. Every project has links between tasks. When one shifts, the rest ripple out. Map those connections so teams can respond quickly and with fewer missteps.
- Review patterns. Use historical data to see when problems tend to surface. Weather and performance trends reveal peak periods and likely slowdowns, so you can prepare before they hit.
- Keep collaboration active. A plan loses strength when it goes stale. Update boards in real time so decisions and changes stay visible to everyone.
You can start refining your process with project management tools that organize shifting details, show dependencies clearly, and keep every contributor working from the same plan.
Resilient Teams Think Visually
Uncertainty is part of the job, but it does not have to derail progress. Teams that work visually build space for flexibility from the start. They see how one decision touches the rest, adjust when new information appears, and stay aligned when conditions shift.
Visual thinking turns planning into an ongoing conversation. The board evolves as the project changes, each update reflecting real circumstances instead of guesswork. Add reliable data sources such as weather insights or performance trends, and the plan adapts instead of breaking.
Every project benefits from a clearer view of what is coming. Whether that means tracking forecasts, managing tasks, or anticipating seasonal patterns, seeing the plan unfold in front of you gives teams the confidence to move forward, no matter what changes next.
Published: October 24, 2025